Using an Asana Gantt chart to arrange your project activities is one of the most helpful methods, whether working alone or with a team. You may manage several projects with various due dates, challenges, and timetables with Asana.
It also allows you to design straightforward project management diagrams that display various activities from various projects and can include Asana or Jira Gantt chart elements like location, weather, time estimates, etc. Interestingly, you may also list tasks, notes, links, attachments, and other project-related information without using another chart. You can also check boxes to indicate when a project item is finished.
What do you know about the Asana Gantt Chart? This article discusses project management charts and the Asana software. The advantages, features, and procedures for creating Asana Gantt Charts will also become clearer. If you are ready, let’s get started.
What is Asana?
There is a reason why seasoned project managers use Asana. Project deadlines, team management, and real-time project planning are just a few of the features it can provide; it is adaptable, customizable, and scalable. Real-time team collaboration is possible with Asana, a well-known project management application. Project managers can use the website or mobile app to access Asana.
A Gantt chart is included with Asana, one of the top solutions for project management software with a schedule. You can view many tasks, keep track of milestones, and identify task dependencies using Gantt charts. Gantt chart software allows you to track the status of every project stage and allocate resources appropriately.
Asana Chart Types
Dashboards in Asana include graphs and charts. These graphs show the team’s daily development, eventually indicating potential roadblocks. The dashboards’ charts populate automatically, and users can add custom charts and statistical roll-ups to see how a project is progressing. Every time a website is accessed or refreshed; dashboards will immediately update to reflect the most recent information. The following are charts you can use in Asana.
Gantt Chart
No matter the scale of the project, a Gantt chart is a form of bar chart that aids in planning and scheduling. It makes complex tasks simpler. We will talk more about this later.
Bar Chart
This is a type of chart that is used to list category data. This chart from Asana’s dashboard shows incomplete tasks broken down by section.
Burnup Chart
It tracks completed work, gauges progress, and shows the overall amount of work still needed. Using the Burnup chart, anyone can follow the team’s speed since Asana supports Agile Development.
Donut Chart
You can use a donut chart to display the percentage of category data. The Donut Chart in the Asana dashboard aids in understanding a project or task’s progress toward completion.
What is Asana Gantt Chart?
Businesses may schedule their tasks and establish the timeline for a project with the help of Asana Gantt Charts. Teams can organize themselves to fulfill deadlines and produce high-quality work with the help of project scheduling. Today, managers may easily plan their projects by using different Asana Gantt chart example. To make the process of charting simpler for new users, Asana offers Asana Gantt chart free templates.
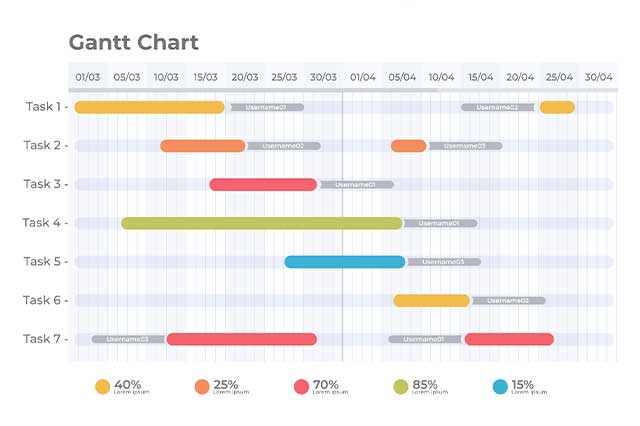
Each bar in a Gantt chart represents a stage of the project, and its length represents the time needed to complete a task. This diagram provides a thorough workflow approach so management can keep track of each task and determine its importance.
Asana Gantt Chart Features
Map Dependencies
With Asana Gantt Charts, team participants may rapidly prioritize their tasks by seeing a timeline. However, some jobs depend on preceding ones, which aids teams or teammates in appreciating the worth of their efforts throughout a project phase. If there is any reason to postpone work, teams can modify dependencies suitably before accepting a new task.
Progress Streamlining
For monitoring project progress, Asana provides a cloud-based platform. Following the team’s online task submission, the Gantt chart is updated. Every time a teammate modifies, the Gantt chart is automatically updated.
Milestones

By crossing horizontal bars by the completion time, Asana Gantt charts aid teams in meeting their targets, which are distinct project phase points. These points’ identification of important dates and times can provide rapid understanding into a project’s schedule.
Schedule
The Asana Gantt charts for a project show each job’s start and end dates. If an activity’s timing interferes with another work, it can be scheduled and planned differently.
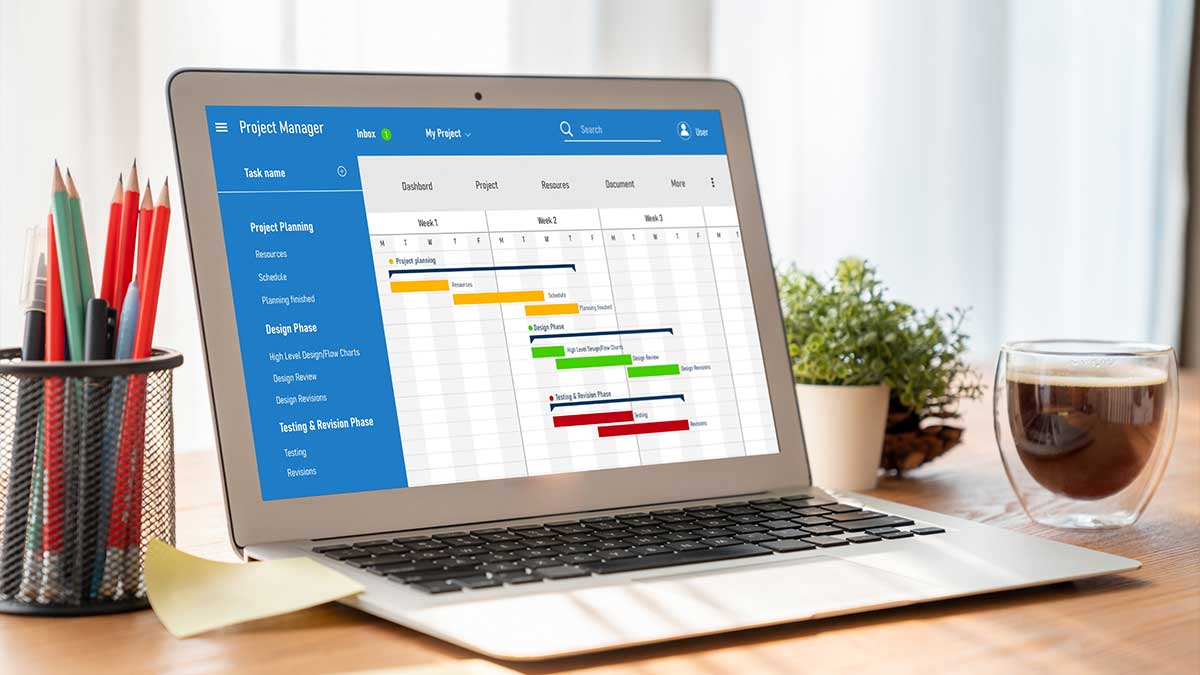
How Asana Gantt Chart Works
Gantt charts have been used for many years. Therefore, you may be familiar with them. Imagine a Gantt chart that has been amplified. An Asana Gantt chart is exactly that. An Asana Gantt chart performs the functions of a Gantt chart as intended and gives the chart access to Asana’s collaborative tools.
Assigning tasks, setting deadlines, and indicating priority levels are all possible for project managers to do with their team members. Afterward, the Gantt chart will automatically appear when you visit the project’s Timeline view.
Asana has included social media-like elements to make team communication simpler and more enjoyable. For instance, both the Asana web page and the mobile app notify a team member when a project is assigned to them. The assignment may be seen, discussed, liked, and marked as finished.
Importance of Asana Gantt Chart
Asana has a slight learning curve while being among the top project management tools for many tasks. Gantt charts, however, may enhance the efficiency of your staff and reporting potential after you master how to use Asana efficiently. Every industry, including small and major businesses, uses Asana Gantt Charts extensively. The advantages of using this Asana Gantt Chart include the following:
Share Project Timelines with Stakeholders
Multiple stakeholders can be informed of project timetables and progress using Asana Gantt charts. You can provide clients, team members, or stakeholders with access to your Gantt chart so they can quickly and easily see the overall scope of your project. In doing this, businesses can increase confidence and trust while guaranteeing everyone is on the same page and informed. Asana allows managers to use the Asana Gantt chart export option, especially when they want to share with other stakeholders.
Streamline Project Planning and Monitoring

You may plan a thorough project schedule utilizing a Gantt chart in Asana, and you can assign tasks according to the importance and the available resources.
You may spot potential scheduling problems and modify your plan as necessary by visually depicting the timeframe and dependencies of each activity in your project. Regardless of how your project develops, this aids in keeping you on schedule and preventing delays.
Keep track of project milestones and dependencies
In Asana, you may keep track of project variables and objectives using a Gantt chart. You can quickly identify which jobs are interdependent with one another and make sure they are finished in the proper order. Additionally, you can specify whether the current task is blocking the chosen task or if it is obstructing it.
A task that has been marked as “blocked by” must be finished before the one that has been added to the dependency. The “blocking” flag indicates that the job assigned to the dependency prevents progress on the current position.
Increase Your Team’s Efficiency in Collaboration
Within Gantt charts, you can create a critical path to indicate the order in which business goals should be prioritized. The critical path is the order in which tasks must be completed for your project to be finished. Establishing a key path facilitates job delegation or work rescheduling to ensure the success of cross-team projects.
How to Create an Asana Gantt Chart
The best time to use an Asana Gantt chart is when the task has a start and finish date. This diagram may be helpful throughout a product launch or marketing campaign, but it may also be important during the preliminary planning stages. The timeline view in Asana facilitates the creation of a Gantt chart for project management. The steps to make an Asana Gantt chart are listed below:
Outlining Schedules
Authorities must schedule tasks’ anticipated start and finish dates before using the Asana Gantt Chart. Assuming a business wants to introduce a new product. The product team begins working on June 1 and anticipates being ready for the market by October 1. As a buffer to account for press on June 1 and last through October 30.
Allocating Tasks

To construct a schedule, drag the tasks you want to do into the essential period in Asana’s timeline view. By modifying the task’s duration, you can specify a task time. Users may also define their preferred time by choosing a certain job.
If a project needs ongoing feedback, it can be further divided into smaller tasks, and related tasks can be color-coded to show the progress of various teams.
Stating Dependencies
Since some activities frequently cannot be started until the completion of others in a project, Asana provides the dependency function. In these situations, a dependence can be established to help teams understand their roles in each task.
Setting Milestones
A project ought to have a few predetermined milestones or checkpoints. These specifics inform management that more of the assignment has been completed. Teams are inspired to participate in their work effectively and actively. When a product passes a test, the Monday Gantt chart displays an event with a line.
A milestone can be established in Asana by choosing a drop-down menu from the Add Tasks button. Decide to add a milestone. The user can also turn an existing task into a project milestone.
Adjusting Plans
Businesses may need more time to report on their growth notwithstanding careful planning. The timeline could be delayed if management requests an additional product review. Plans inevitably change, and Asana varies, as necessary. An individual job can be rescheduled by clicking on it and altering the date, or the whole task can be moved.
If it becomes necessary to move several jobs or projects at once, this can be accomplished by selecting and dragging the relevant elements. A complete picture of the rearranged workflow is provided by Asana Gantt Charts, which automatically moves linked dependencies.
Conclusion
A Gantt chart created in Asana is an effective tool for scheduling, arranging, and monitoring a project’s or task’s progress. You can choose any Asana Gantt chart template most appropriate for your undertaking and industry from the Asana Template Library. Furthermore, an Asana Gantt chart allows for much customization, making it simple to set up a “war room” setting for project management.
FAQs
What is the best Gantt chart for Asana?
The most used Gantt chart for Asana is Instagantt. Instagantt Asana charts synchronize in two directions with Asana so that you always see the most recent data in the charts. Asana also updates to reflect any changes made on the Gantt chart.
How do I create a project tracker in Asana?
To share with your team and other teams, you could utilize Asana to develop a digital project tracking template. Making a new project, outlining any required sections and activities, and then saving it as a template will allow you to create it.
Why is Asana the best project management tool?
The platform provided by Asana enables team members to collaborate and communicate in real time while working on projects. Asana’s intuitive UI and customizable settings make tracking progress, assigning tasks, and communicating with team members simple. Besides this, the Asana Gantt chart pdf export option is another feature that makes project managers decide that Asana is the best project management tool.
What is the difference between the Gantt chart and the Kanban board?
Dependencies are shown on the Gantt chart as arrows connecting the dependent tasks. This clearly illustrates which tasks are interdependent and which must be completed first. On the other side, there is no display of interdependence on the project board itself with the Kanban board.
Is Asana better than Trello for project timelines?
If you’re in charge of a small team, Asana is the project management tool you should use if you want to oversee tasks for more than one individual. If you require a graphic project management solution and rarely need to assign team members to specific tasks, you should choose Trello.